Your traffic chart now counts agents

This month a lot of B2B teams will open the same file. It holds a year of sessions and form submissions, and it is about to become the base for every 2027 target. This year that file counts something it did not count before.
The baseline everyone is about to lock
Planning season works the same way in most B2B teams. Someone exports sessions and form submissions for the year and draws the trend. The 2027 target goes a few percent above it. Paid media, content and SEO are then judged against that line for twelve months.
The chart is read as people. Every session is a potential buyer, every form fill is demand. Few teams check what the chart is made of, because for years the bots in it were mostly crawlers that analytics tools already knew how to filter.
Who is actually in the chart
This autumn the mix changed. DataDome's AI Traffic Report for Q3 2026, published on 15 October, counted nearly 25 billion AI agent requests across its network in the quarter, up 41.5% on Q2. Nearly half of the AI agent traffic it recorded in 2026 through September arrived in Q3 alone.
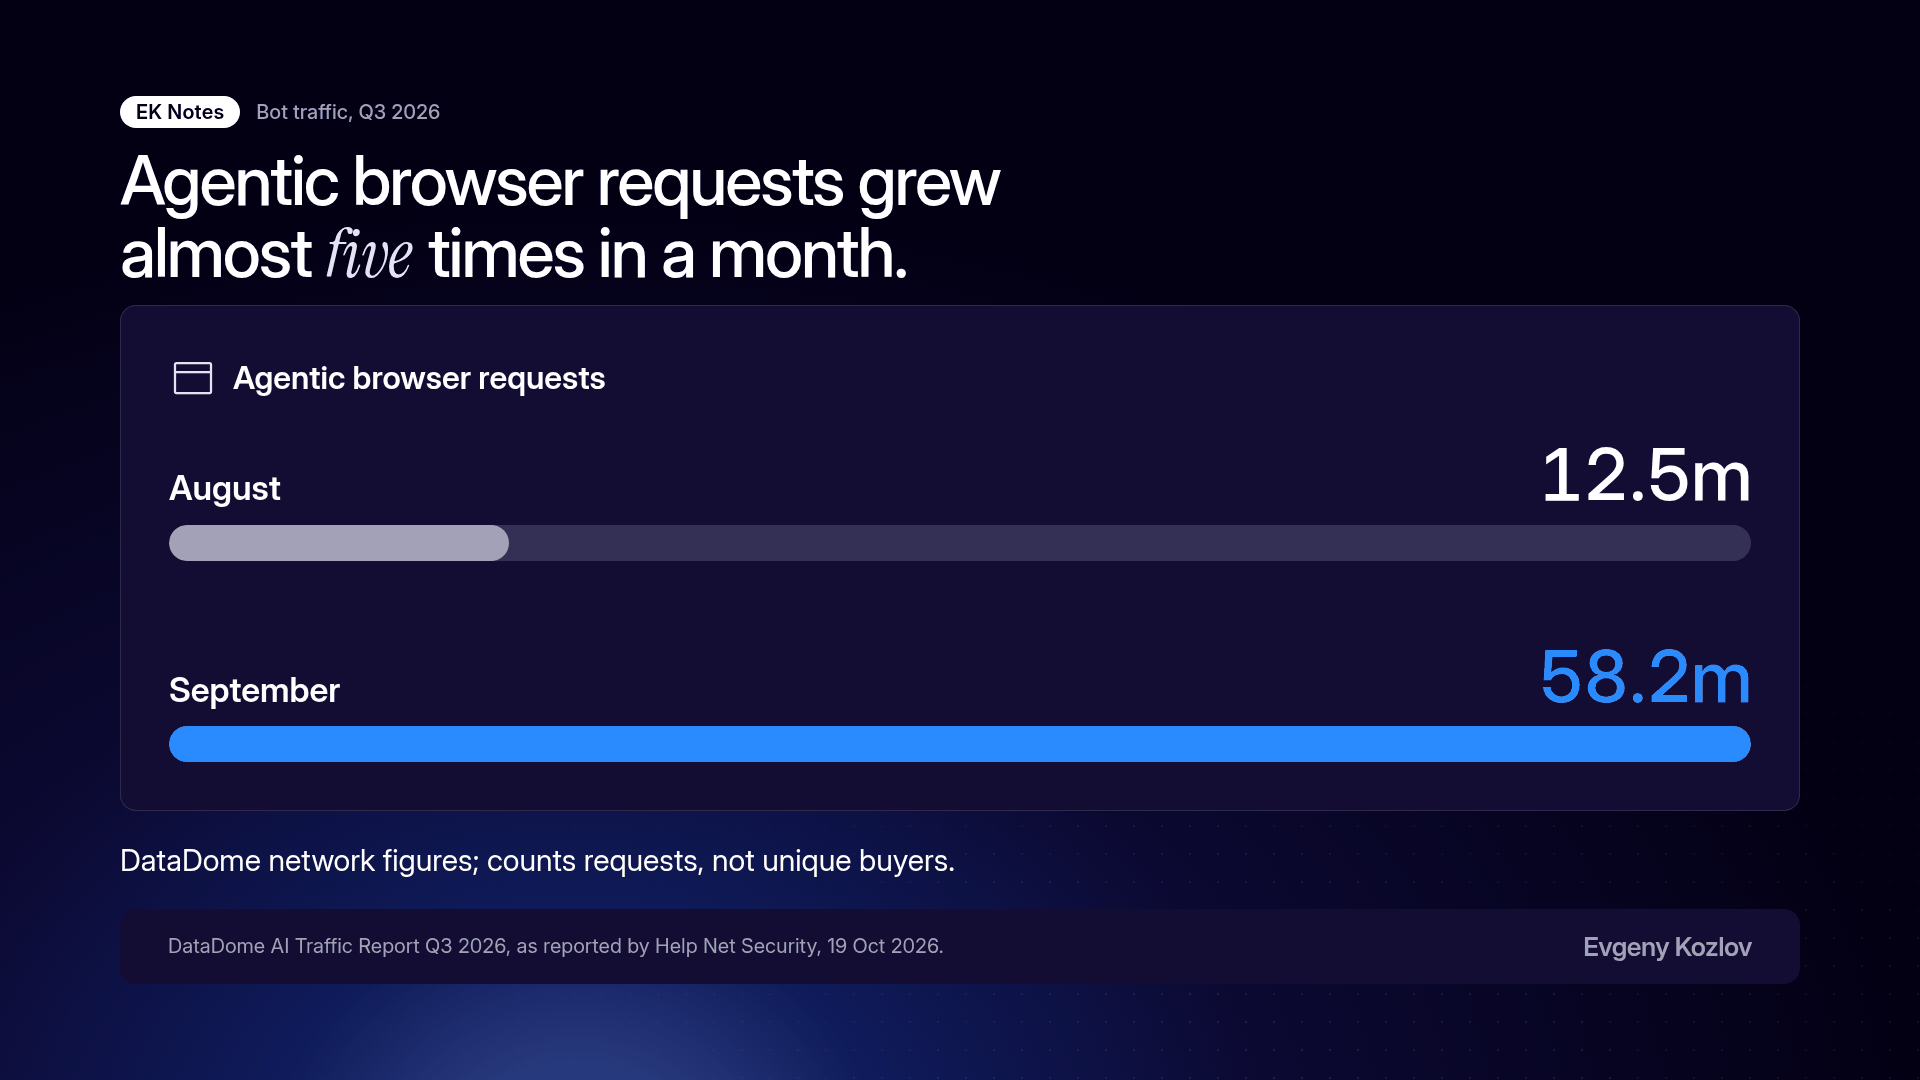
The fastest line is agentic browsers: AI agents that open a real browser and move through a site on a user's behalf. In DataDome's data their requests went from 12.5 million in August to 58.2 million in September, almost five times in one month. A large part of the jump was Muse, a personal agent that runs a browser in its own cloud machine. In a sample of its traffic, 8.9% of requests reached sensitive pages: login, payment, account creation, cart and forms. Forms took 81% of that share.
So part of your website audience is now software acting for a buyer. It reads the pricing page, compares the feature table and, more and more often, reaches the form. The named-bot settings site owners use to allow or block crawlers do not cover agents that browse through a regular browser. Some of this traffic lands in your sessions and your submissions.
That is the part nobody puts on the planning slide. The 2027 traffic target is not set on people. It is set on people plus agents plus whatever automation got through, in a ratio nobody in the room knows. A target on that baseline is a growth rate attached to a number nobody has opened up.
One split before targets lock
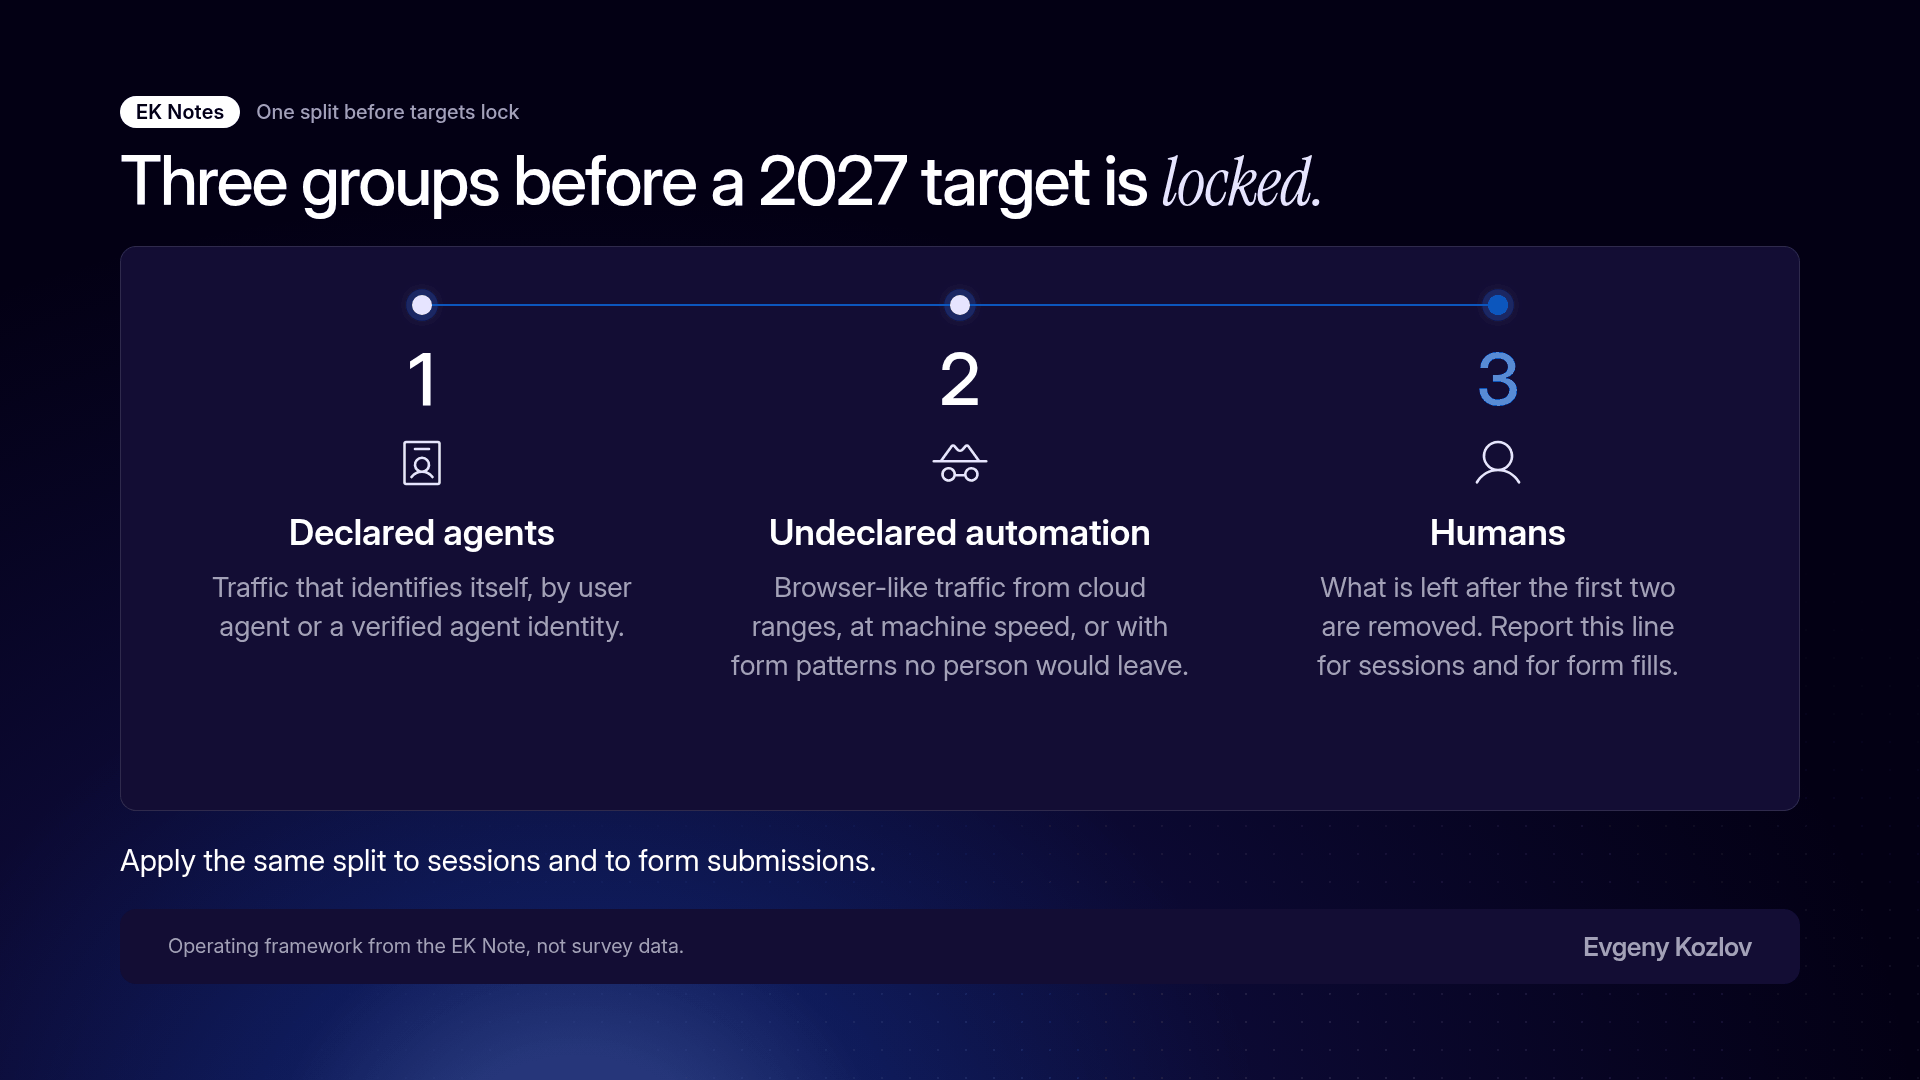
The fix is not a new dashboard. It is one request to analytics or RevOps before the 2027 numbers are agreed: split sessions and form submissions into three groups.
- Declared agents: traffic that identifies itself, by user agent or a verified agent identity.
- Undeclared automation: traffic that behaves like a browser but comes from cloud and data-centre ranges, moves at machine speed or fills forms in patterns no person would.
- Humans: what is left after the first two are removed.
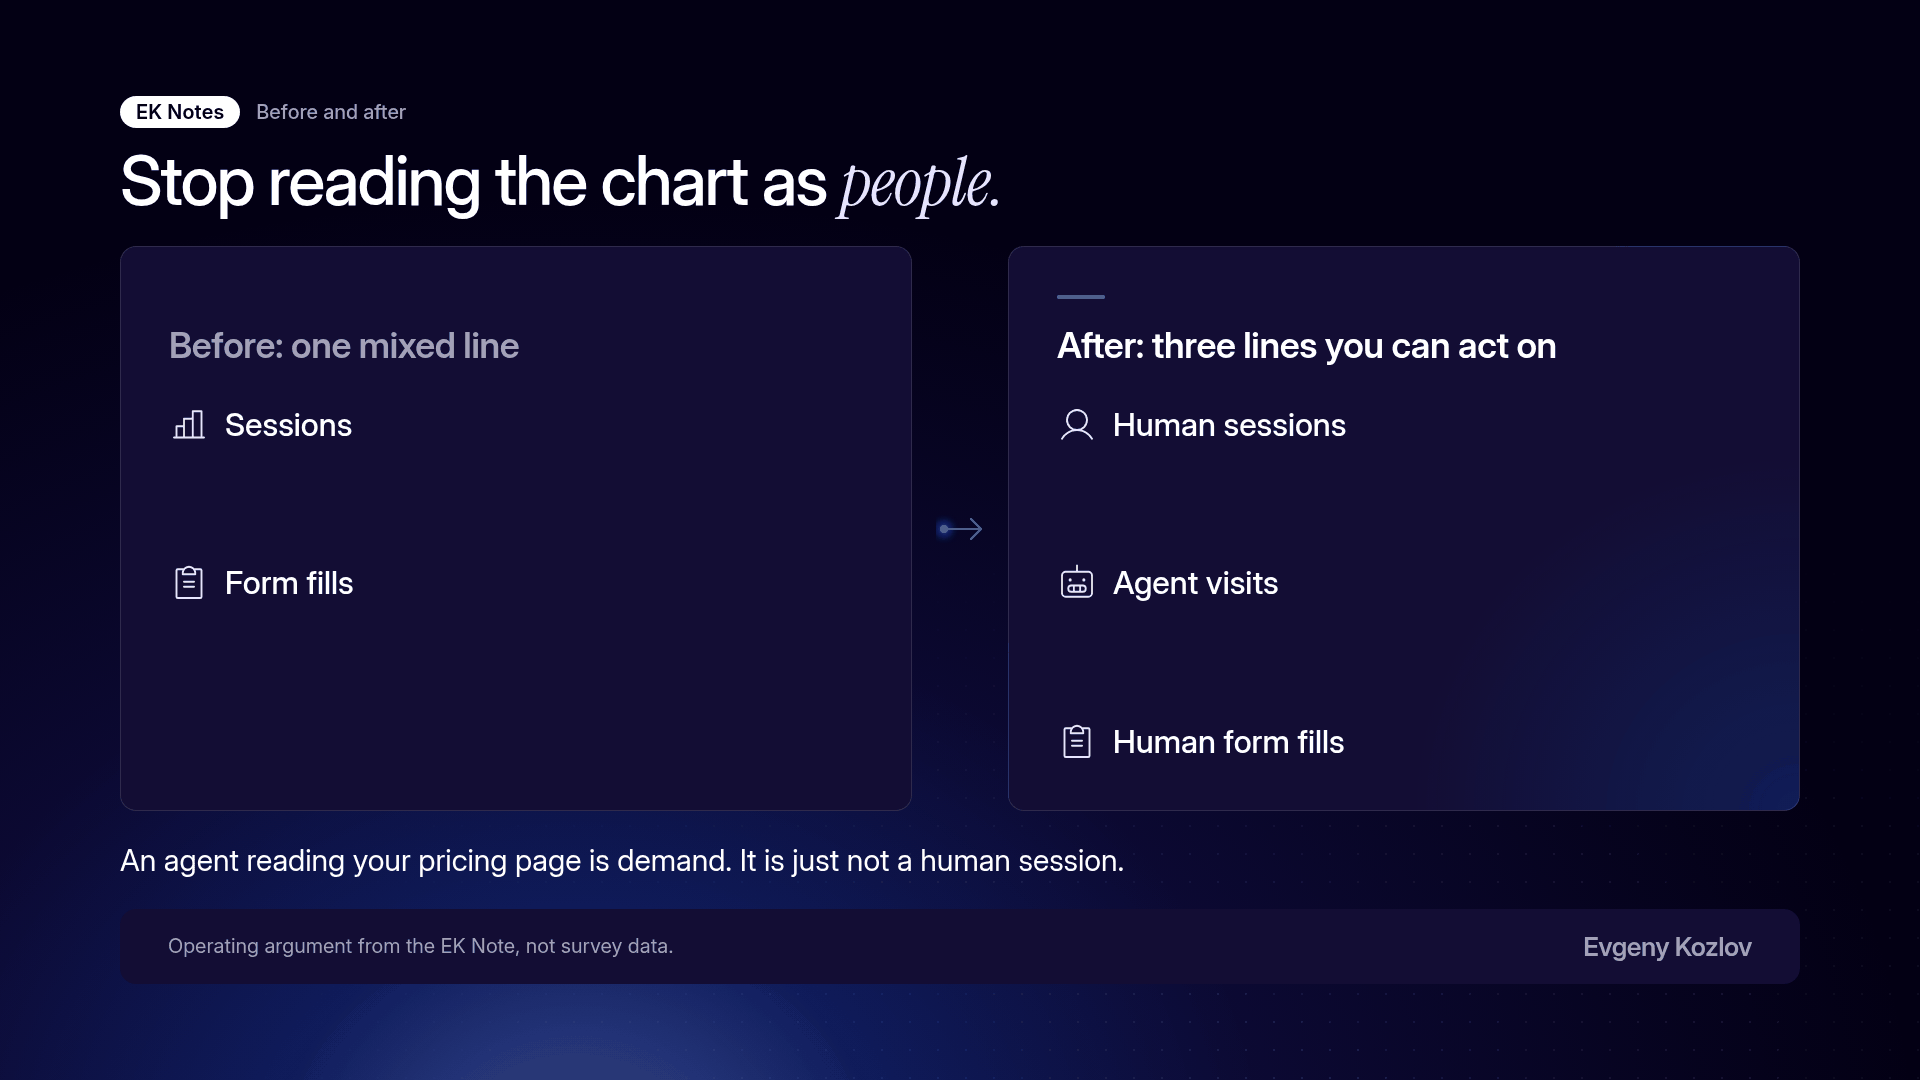
Then report two lines instead of one: human sessions and agent visits. Do the same for form fills, and check a sample of the suspected agent submissions by hand to see whether any of them turn into a conversation.
The first split will be rough. The second group is a judgement call, and your bot-management or CDN provider will have its own view of it. A rough split is still better than a target set on a number everyone now knows is mixed.
The brake
This is not an argument for blocking agents. An agent reading your pricing page for a buyer is demand. It is just not a human session, and it should not be measured or optimised like one. Block it and you may drop off the shortlist it was building. The work is to separate the two lines, then make the pages agents read clear enough to answer from.
Confirmed and plausible
Confirmed: the DataDome figures above, from its AI Traffic Report Q3 2026 (release of 15 October) as reported by Help Net Security on 19 October 2026, read on 27 October. DataDome sells bot management, the numbers come from its own customer network rather than the whole web, and they count requests, not unique buyers.
Plausible, not proven: that a meaningful share of a typical B2B site's 2026 sessions and form fills came from agents. I found no public benchmark for B2B sites, and the share will vary a lot by sector. That is the reason to run the split on your own data before the target is set.
Your traffic chart is real. It may just be counting the wrong thing. Before it becomes a 2027 target, find out how much of it is people.
Sources
- Help Net Security, "Half the AI bot traffic hammering your website comes from Meta", 19 Oct 2026, read 27 Oct 2026 (DataDome AI Traffic Report Q3 2026: AI agent traffic +41.5% QoQ to nearly 25bn requests; nearly half of 2026 AI agent traffic through September in Q3; agentic browser requests 12.5m in August to 58.2m in September; Muse sample: 8.9% of requests to login, payment, account creation, cart and form pages, forms 81% of that; named-bot controls do not cover agents browsing via a regular browser.)
- DataDome via Business Wire, "DataDome Report: Agentic Browser Traffic Surged Nearly 5x in a Month as Meta's Muse Arrived Unannounced From the Cloud", 15 Oct 2026 (page timed out on 27 Oct; figures taken from the Help Net Security coverage and the 26 Oct proposal research.)
Related notes
- AI shortlists drop vendors whose claims can't be verifiedThe claim nobody can check costs you the deal. AI builds the shortlist, but a vendor stays on it only when a stranger can confirm the claim. Before 2027 campaigns launch, give every top claim a named proof or cut it.
- In production is not in useIn 2012 taxi apps topped every innovation ranking while 1.5% of Londoners had tried one. In 2026 "in production" plays the same role on AI slides. Judge 2027 AI lines on weekly users, checking hours and what breaks without them.
- Your AI SDR is a deliverability programAn outbound agent on a big list mostly spends your sender reputation. Replies come from small segments, checkable facts and a human edit.